Classy Sell-Throughs: Using Python to Find Sell Through Rates
Finding particular and focused insights within a large amount of individual items.

CASE: Square is a fantastic service that allows many small businesses to easily create simple reports while integrating with their devices for a straightforward and streamlined data collection process. While the cost of goods sold and sell through reports of the complete catalog are great, there is more needed to create more particular, focused insights like the sell through rate per vendor or per class of clothing item. Fortunately, Python can solve these querying issues and calculations by using Pandas to sort and add data from basic datasets such as the sales per item report offered by Square.
Problem:
Management would like a yearly report of sell throughs of each class per vendor, Square does not currently offer this filter and only offers sell through per each item of the catalog, of which there are over 10,000 when including each size per item per vendor.
Items SKUs are numeric and the Item’s debut season is represented by the first number of the SKU. Either because of its numeric value or lack of input for seasonal offerings, it cannot filter the SKUs that begin with 5, as these represent clothing offered for the Fall of 2022 season.
Items ordered are either not represented in these reports or are not recorded, therefore the order totals must be found by adding total ordered + total sold.
SOLUTION: Write a Python script that finds the requested values from the item sold report by matching values from the catalog to the sales report to find the sell through rate by class per vendor.
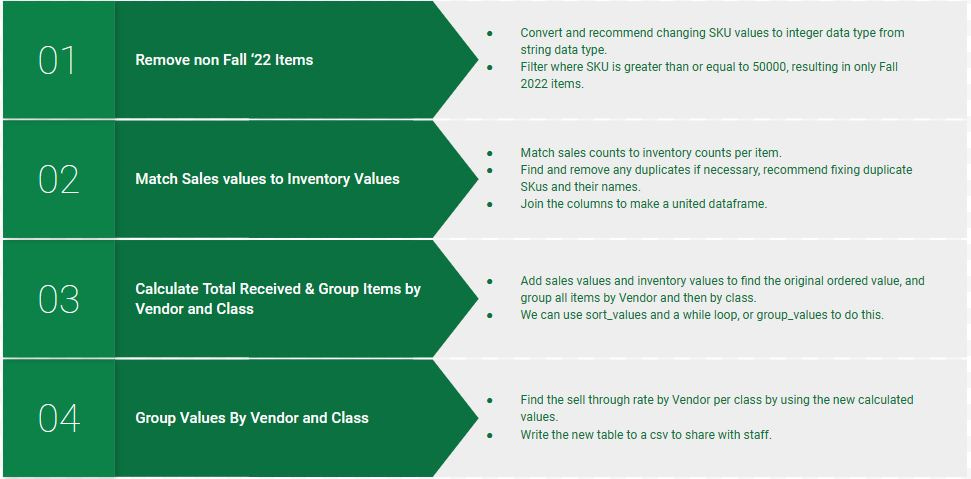
We can begin by filtering the SKUs by season very easily with one line with the Pandas package:
fallsalesdf = itemsalesdf.query('SKU >= 50000’)We can then begin comparing and filtering values from the Catalog list to the Sales List:
catalogmatched = catalogdf.isin(itemlist)Using Pandas isin function to find SKUs that are in both arrays, we can then use filter function to find all rows with items that are not in the sales report and remove them by their index numbers in the original array, leaving us with only matching values in both tables.
catalogfiltered = catalogmatched.query('SKU != True')
indexlist = catalogfiltered.index
catalogfinal = catalogdf.drop(indexlist, axis='index')
We then take the orders of each item and append them to the sales dataframe.
Now we can begin adding each item by class per vendor, simply using a while loop to add values row by row if values from each column match letter for letter. To help us do this we can use another Pandas function, sort_values. This function will filter the data by two columns at the same time, allowing us to filter and group classes and vendors with one line of code:
sellthrufiltered = sellthrudf.sort_values(by = ['item vendor', 'item class'])We can then loop through each list like rows and add values together if their class and vendor match.
i = 0
j = 1
while i < len(vendornames):
  if vendorname[i] == vendorname[j]:
    if classname[i] == classname[j]:
      itemsales[i] += itemsales[j]
      itemsales.pop(j)
  i += 1
  j += 1
Now that we have the items sold and in inventory by class per vendor, we can find the value for original orders:
for index, row in sellthroughdf1.iterrows():
  y = (row['sales count']) + (row['inventory count'])
  ordercounts.append(y)
Now we simply add the sell through rate logic to the previous equation:
z = (row['sales count']) / y
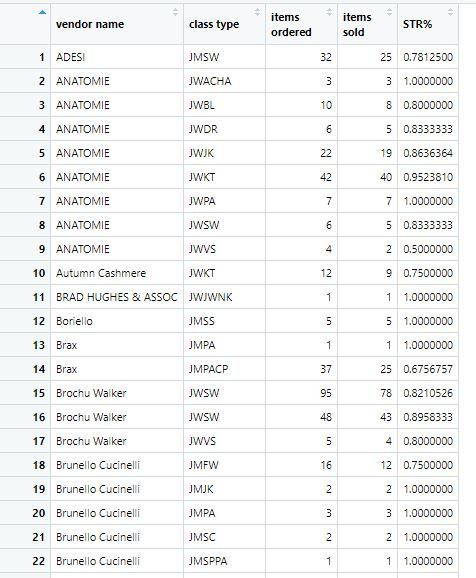
thrupercents.append(z)We now have a Python lists of each classes’ order counts and sell through percentages by class per vendor: